The Laplace Distribution and how it may be a better fit than the standard distribution used in the Black-Scholes model
I am a large fan of the Optimal F model developed by Ralph Vince. There has been many hours logged on my computer, testing and retesting his methodologies in many different configurations. However, in my search for larger market returns, there was one component that always seemed missing. That component would be an actual trading strategy or system which would lend itself to a predictable advantage.
In the world of trading systems, there is a plethora of claims being made. Most of them are false. If a trading strategy can only work in one market, it’s not really a strategy, but rather some sort of market anomaly, which can easily be washed out. That is one of the issues that Renaissance Technologies (Jim Simmons) kept running into when he was running his fund. You had to keep finding new anomalies in the market and exploiting them before they disappeared.
Thus, in order to come up with a true advantage, you must identify certain facts which are constant across all markets. I wish to share one of those facts with you today.
I read an article years ago which claimed that daily market returns could be best described by the Laplace distribution rather than a normal standard distribution, which is used in the Black-Scholes options pricing model. I soon went to testing this theory and discovered it to be quite true. However, the article only expressed this anomaly occurring in equity markets. I wanted to see if it actually occurred in commodity markets as well.
Before I actually show you the graphs and explain the implications. Here’s just a little bit of background on the Laplace distribution and how to code this up yourself.
First let’s examine the difference between the distribution probability density functions.
Here is the normal standard distribution probability density function.
\[f(x) = \frac{1}{\sqrt{2\pi\sigma^2}}e^{-\frac{(x-\mu)^2}{2\sigma^2}}\]
And below is the Laplace distribution probability density function.
\[f(x | \mu, b) = \frac{1}{2b}\exp\left(-\left|\frac{x - \mu}{b}\right|\right)\]
These equations can look slightly intimidating to the normal non-math nerd among us. Luckily for us, Python has some very interesting libraries which allow us to use these type of probability density functions with just a few lines of code.
By calling for the SciPy library.
import scipy.stats as statsWe can play around with all sorts of different probability density functions in order to best fit our actual daily returns. Here’s just a couple of functions I defined in my code for your reference.
           def Histogram_200_1(Column):
               ax = df[Column].plot.hist(density=True, bins=252, alpha=0.75, color='green', label='1 Day Returns')
               ax.set_title(sym +' 1 Day Returns')
               ax.set_xlabel('Returns in %')
               ax.set_ylabel('Frequency')
               plt.plot(x, pdf_fitted, color='black', label='Laplace PDF')
               plt.legend()
               plt.grid(True)
               plt.figure(figsize=(10,6))
               plt.figure(dpi=1200)
               return plt.show()

           def fit_laplace(Column):
               params = stats.laplace.fit(df[Column])
               x = np.linspace(min(df[Column]), max(df[Column]), 252)
               pdf_fitted = stats.laplace.pdf(x, *params)
               return x, pdf_fitted
Now it’s time for the shocking results.
Remember my statement from earlier. Any trading strategy must work across all markets and in all time frames If it is to be robust enough to actually be utilized in a Kelly Criteria or Optimal F money management system.
First, let us examine the daily returns of a common and popular stock. We will use NVIDIA as an example.
By placing our daily returns into a histogram and overlaying it with a Laplace fit curve, we can easily see the daily returns best match a Laplace distribution. See the figure below.
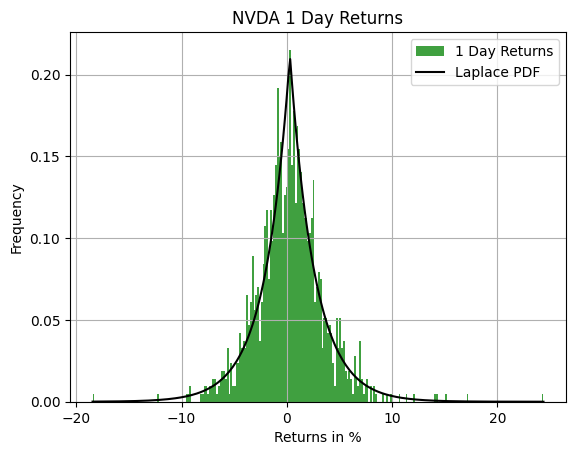
Okay that fits pretty well. However, NVIDIA is a stock that has had so much hype, given the AI revolution that’s occurring, perhaps it is a standalone anomaly. What if we were to test it on another stock? Perhaps one that doesn’t get as much claim and news mentions. Let’s try the same exercise on John Deere.
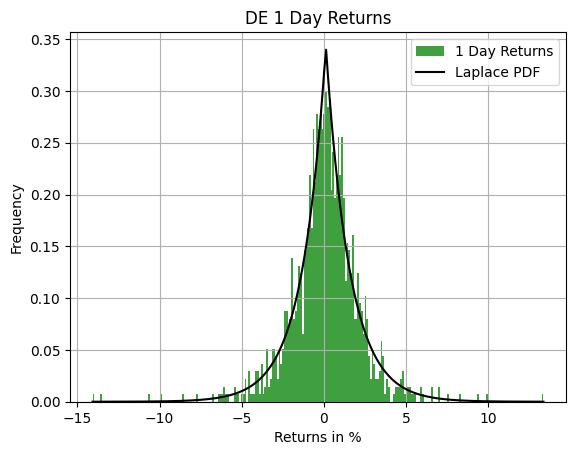
Given this histogram we can now see that the Laplace distribution accurately describes daily returns of the equity markets. I tested many more equities than just these two. Let me assure you, every equity I tested came out looking the same. The Laplace fit was the correct fit each time!
Okay, so we know the Laplace distribution works in equities across the board. However, if it is actually noteworthy and worth utilizing in our strategies, it must also work in commodities as well. If it does, then the Laplace distribution no longer is just defining something that occurs in the market, but it’s defining the actual buying and selling behavior of markets in general.
Let’s take a look at a very base commodity. Let’s examine corn.
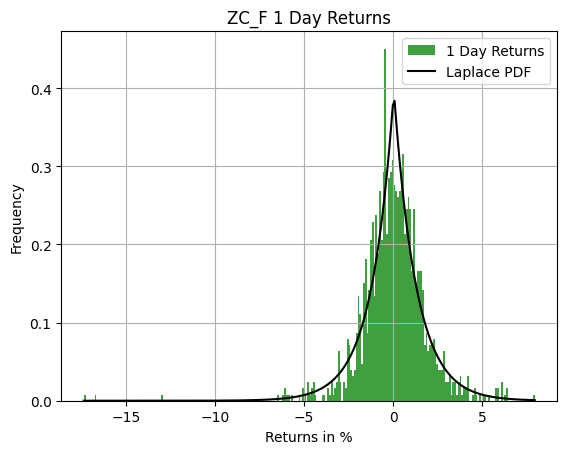
Look at that! (Don’t worry about the long tail…futures contracts can have some wild swings based on the rolls…But I wanted to capture it because a trader may get caught by such an event!)
I tested this in Gold, Oil, Wheat. It doesn’t matter. It always accurately describes daily returns of any market.
Implications
It may be tempting to suspect there is an arbitrage opportunity between the two probability density functions. Perhaps one could actually model option pricing based on a Laplace distribution and then try to buy and sell options contracts priced on other models. However, I believe slippage and actual market spreads would negate this strategy.
I do have one theory in mind…but I want to test it first before I show it to the world. If it’s successful, I probably wouldn’t share it anyway.
Nevertheless, these figures show some stark realities.
- Markets move very slowly most of the time. They oscillate, constantly trying to find the correct price between buyers and sellers.
- Market behavior is the same across all markets. Trading algorithms do not have the final say after all.
If you have anything to add to this research, I would love to hear from you. Please go to the menu at the top of this page, click CONTACT, and send me a message.
Jonathan Adams
July 31st, 2025